Most people entering the online casino industry for the first time arrive with a surface-level understanding of how the money works. Players deposit, players bet, the house takes a percentage over time. Simple enough in principle. But once you are actually running a platform — managing bonuses, negotiating with software providers, reporting to investors, making decisions about where to spend on player acquisition — you need a more precise language for what is happening financially.
GGR and NGR are the two numbers that matter most. Everything else in casino finance is either derived from them or exists to explain them.
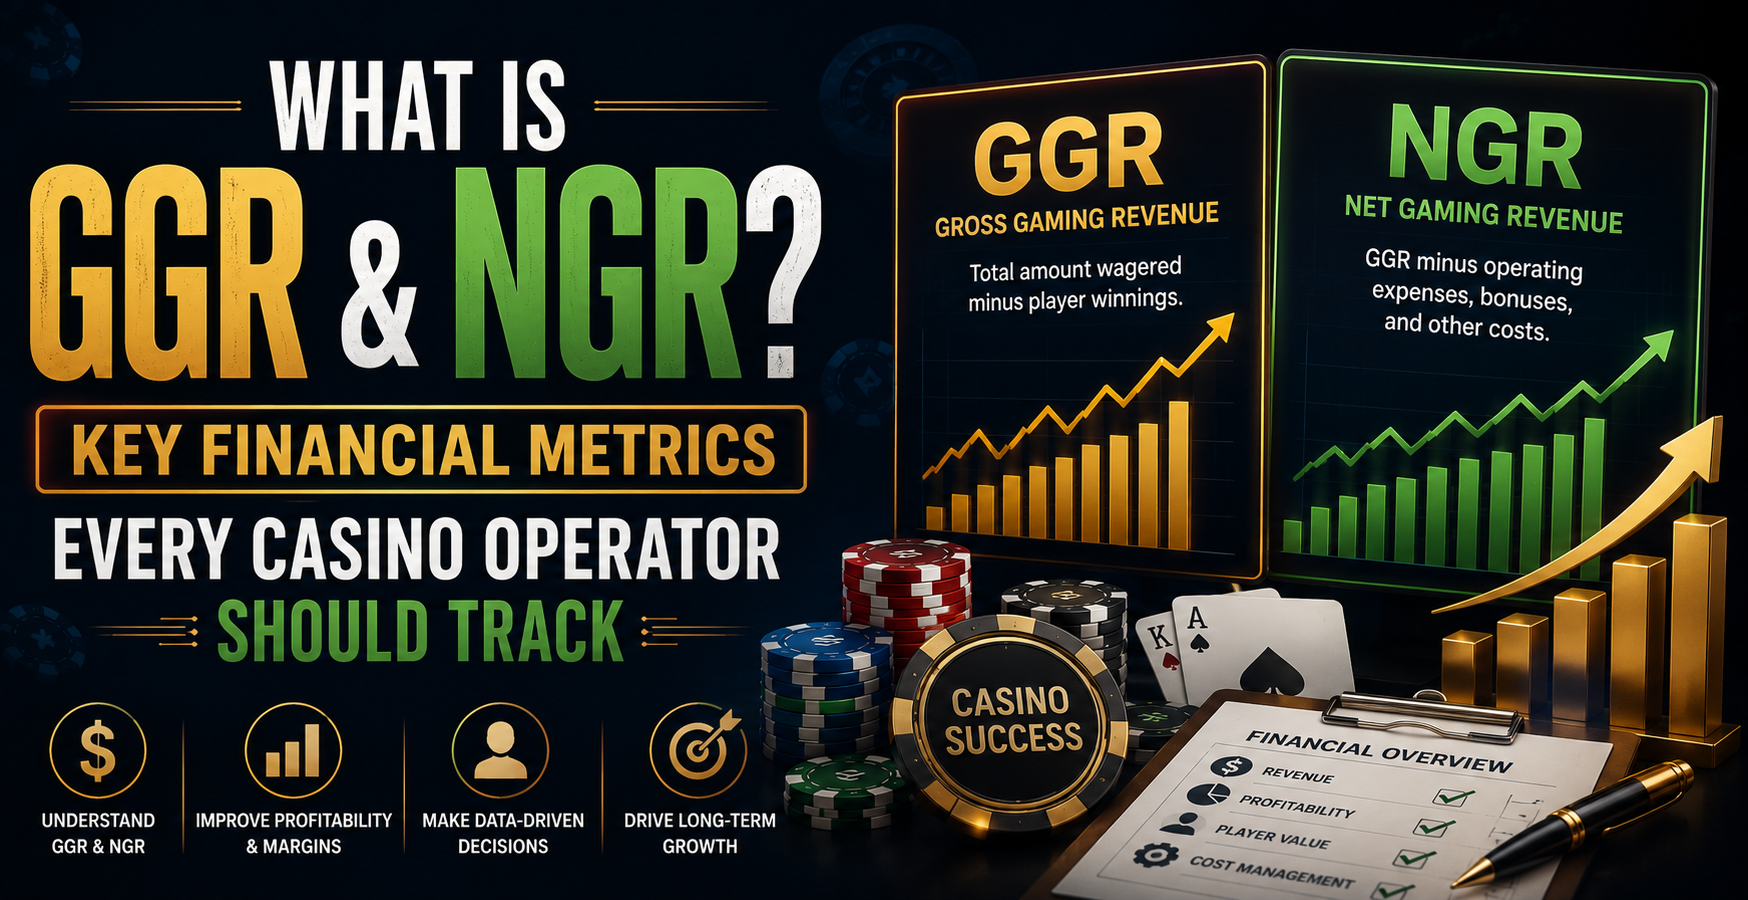
What Is GGR?
GGR stands for Gross Gaming Revenue. It is the total amount wagered by players minus the total amount paid back out in winnings. In other words, it is what the house keeps before any costs are deducted.
The formula is straightforward:
GGR = Total Bets Placed − Total Winnings Paid Out
If players collectively wagered $1,000,000 in a month and walked away with $950,000 in winnings, the GGR for that month is $50,000. The house edge built into the games — the theoretical return to player percentage flipped to the operator’s perspective — determines how GGR accumulates over time relative to total wagering volume.
GGR is a gross figure. It does not account for bonuses, taxes, payment processing fees, software costs, or anything else. It is simply the raw revenue generated by the games before the real world intervenes.
This matters because GGR is the number regulators care about most. Licensing authorities in jurisdictions like Malta, Curaçao, and Gibraltar calculate gaming taxes as a percentage of GGR. It is also the figure most commonly used when comparing platform performance across markets, because it strips out the operational variables that differ from one business to another and focuses purely on how much the games generated.
What Is NGR?
NGR stands for Net Gaming Revenue. It takes GGR as the starting point and then deducts the costs that are directly tied to generating that revenue — primarily bonuses and promotions, payment processing fees, and in some calculations, affiliate commissions.
The most common formula looks like this:
NGR = GGR − Bonuses and Promotions − Payment Processing Fees − Affiliate Costs
Some operators also deduct gaming taxes at this stage, though practice varies by market and reporting context. The key point is that NGR represents the revenue the business actually retains after the direct costs of acquiring and paying out to players are accounted for.
Using the earlier example: $50,000 GGR, minus $15,000 in bonus costs, minus $3,000 in payment fees, minus $7,000 in affiliate commissions, leaves an NGR of $25,000. That $25,000 is what the operator has to work with before fixed operating costs — staff, technology, licensing, marketing — are applied.
NGR is the number that tells you whether your business model is actually working. A platform can generate impressive GGR figures while running NGR that barely covers overhead, usually because bonus structures are too aggressive or affiliate deals are priced incorrectly. This is one of the most common financial problems new operators encounter, and it is almost always invisible until you are tracking NGR properly.
Why Both Numbers Matter
GGR and NGR answer different questions, and operators who only track one of them are operating with incomplete information.
GGR tells you about game performance and wagering volume. If GGR is growing month on month, more players are betting more money. That is a useful signal about acquisition, retention, and the appeal of your game lobby. It is the number you use when talking to game providers about performance, and the one that dominates regulatory conversations.
NGR tells you about business health. It reflects the actual revenue available to fund operations after the direct costs of generating GGR are paid. Two operators with identical GGR can have dramatically different NGR depending on how aggressively they bonus players, what they pay affiliates, and what their payment infrastructure costs them.
The relationship between the two — NGR as a percentage of GGR — is one of the most important ratios an operator can track. A healthy NGR margin varies by market and business model, but a sustained and significant gap between the two numbers is always a signal that something in the cost structure needs attention.
The Costs That Sit Between GGR and NGR
Understanding what drives the gap between GGR and NGR is where operators can make meaningful improvements to profitability.
Bonuses are typically the largest line item. Welcome packages, reload offers, free spins, and cashback programmes all reduce NGR directly. This does not mean bonuses are bad — they drive player acquisition and retention, both of which feed future GGR. But poorly designed bonus structures, particularly those with low wagering requirements or wide game contribution eligibility, can erode NGR faster than the acquired players ever recover it. Tracking bonus cost as a percentage of GGR gives you a clear view of whether your promotional spend is calibrated correctly.
Payment processing fees vary considerably by payment method and provider. Cryptocurrency transactions tend to carry lower fees than credit card processing. Local bank transfer integrations in Southeast Asian markets can vary widely depending on the provider and volume tier. Operators building on capable casino software solutions will have aggregated payment reporting that makes these costs visible by method and market — essential for identifying where processing costs are eating into margin unnecessarily.
Affiliate commissions are often structured as a revenue share percentage of NGR, which creates an alignment of interests — affiliates only earn when the operator earns. However, CPA-based affiliate deals, where a flat fee is paid per depositing player regardless of subsequent behaviour, can significantly compress NGR if the acquired players perform below expectations. Tracking the NGR contribution of each affiliate channel separately is the only way to know which partnerships are genuinely profitable.
Other Metrics That Work Alongside GGR and NGR
GGR and NGR do not exist in isolation. Several supporting metrics help explain what is driving them and where to focus operational attention.
ARPU — Average Revenue Per User — divides GGR or NGR by the number of active players in a period. It tells you whether revenue growth is coming from acquiring more players or from existing players betting more. Both can be valid, but they require different operational responses.
Player Lifetime Value (LTV) projects the total NGR a player cohort will generate over their active lifecycle. Operators with strong LTV data can make more confident decisions about how much to spend on acquisition and bonuses, because they know what each player segment is actually worth long-term.
Hold Percentage is GGR divided by total wagers, expressed as a percentage. It reflects how much of every dollar wagered the platform retains as gross revenue. Comparing actual hold percentage to theoretical hold — based on the RTPs of the games in your lobby — tells you whether variance is running in your favour or against you over a given period.
These metrics come to life when your reporting infrastructure is set up to surface them clearly. Operators working with a proper online casino software provider whose back office includes real-time financial dashboards should have all of these figures accessible without needing to manually pull and reconcile data across disconnected systems. Those who cannot see their GGR, NGR, bonus cost, and hold percentage in one place are making business decisions with a partial picture.
Putting It Into Practice
Tracking GGR and NGR consistently, and understanding what is driving the gap between them, is the foundation of running an online casino as a real business rather than guessing at profitability.
New operators tend to focus almost entirely on GGR in the early months — because it is the most visible number and because growing it feels like progress. The danger is that NGR is quietly telling a different story. Generous welcome bonuses attracting players who churn immediately after clearing the wagering requirement. Affiliate deals structured on CPA terms for a player quality that never materialises. Payment processing costs quietly compounding as transaction volumes grow.
None of these problems are impossible to fix. But they are only fixable once they are visible. GGR and NGR, tracked together and reviewed consistently, make them visible. That is the whole point.
Recommended
 Unveiling the Secrets to Finding the Perfect Online Casino Software for the Gambling Platform
Unveiling the Secrets to Finding the Perfect Online Casino Software for the Gambling Platform
 How TT Wonders Helps Startups Become Recognized Names
How TT Wonders Helps Startups Become Recognized Names
 Everything You Need to Know About White Label Online Casinos


